
66Uploads
6k+Views
5k+Downloads
Business and finance


Payback Period (PBP) Worksheet
A simple worksheet where students need to calculate the payback period of 4 investment options.
Answer key included
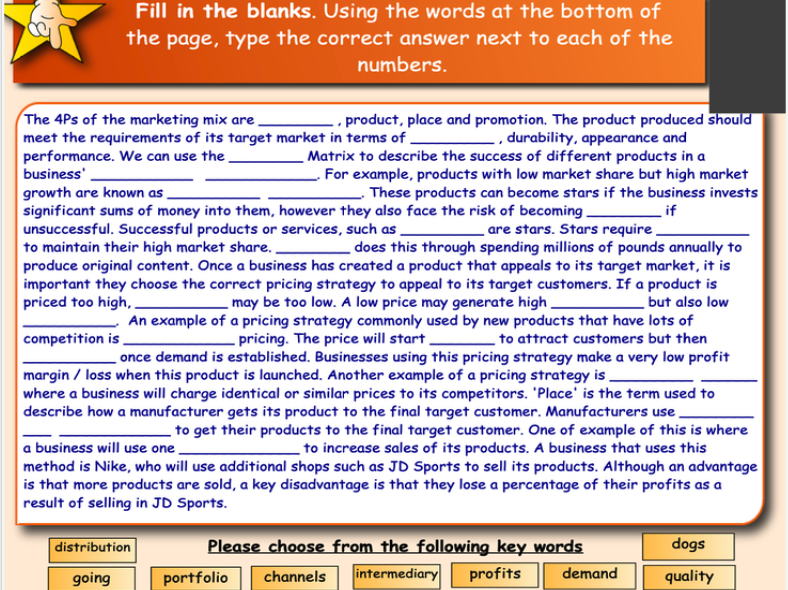
Marketing Mix RECAP STARTER
A fill the blanks activity on the 4Ps with emphasis on Boston Matrix
Answers are included
This is useful as a starter activity or plenary

Cash Flow Forecast Activity
Test your students’ knowledge of cash flow forecasts with this UNIQUE activity that demonstrates if students can calculate each of the different values.
This cash flow forecast contains a number of intentional errors that students need to identify and correct.
All instructions are included in the activity, but the key thing to note is that all yellow values cannot change, any others can.
Included in this activity are the following:
Page 1 - Instructions on how to complete the activity, a cash flow forecast (in colour) and an explanation of what the first error is and how it should have been calculated.
Page 2 - All errors have been circled. This can be shown after the cash flow forecast has been completed.
Pages 2 and 3 - Detailed explanations of all errors and how they should have been calculated.
Page 4 - The completed cash flow forecast with all answers.
How I run the activity:
Give students up to 10 minutes to complete the cash flow forecast
Once finished, ask students to explain any errors they have found (this took my class 10 minutes)
Show the circled errors on the board so that students can circle them
Explain each error in detail
Show the completed cash flow forecast on page 3 and get students to mark them. This will save you time.

Average Rate of Return
Included in this lesson:
A detailed and colourful title slide, including all learning objectives for this topic
A recap starter activity on calculating the payback period (answers included)
An explanation slide as to what the lesson is about; providing an overview of the problems of relying solely on the payback period as a method of investment appraisal and why other methods are also needed
Explanation of what ARR is
A scenario showing how ARR is calculated
An evaluation of ARR
There are 22 slides in total and it took me around 30 minutes to go through the presentation.


Sales Forecasting, Market Analysis Worksheet
This worksheet contains a range of sales forecasting and market analysis activities. All answers are included.
Included in this worksheet are activities on:
Market share
Interpreting bar charts
Scatter diagrams
Line of best fit
Extrapolation
Moving averages
Positive, negative or unrelated correlation
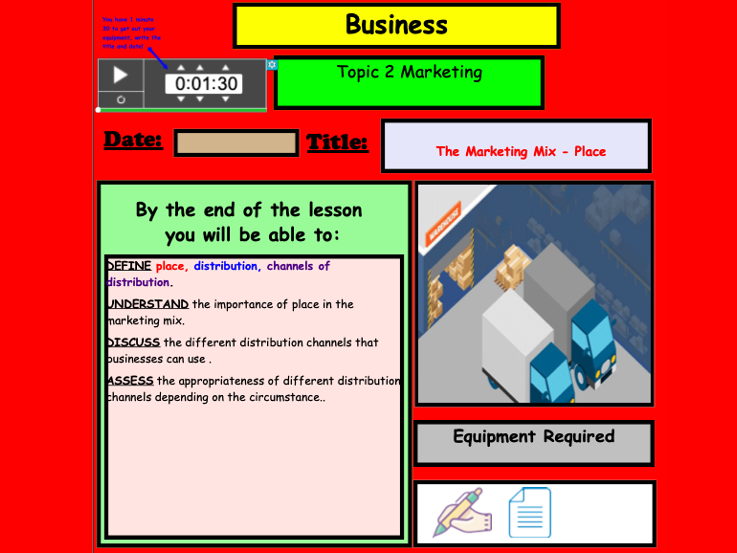
Marketing Mix - Place
Included in this presentation:
A fun Catchphrase starter activity (my students love this!)
A recap activity on cost-based pricing strategies with answers (feel free to remove or skip if you are you to cover this)
Notes and examples on the different methods of distribution
Notes on the pros and cons of each method of distribution
Notes on the importance of selecting the most appropriate method of distribution

Break-Even Analysis Worksheet
4 Practice break-even diagram questions with answers provided
Can be printed used in lessons or as revision

Cash Flow Forecast Full Worksheet
This worksheet tests students understanding of the importance of cash, cash flow forecasts and how to solve cash flow problems.
There are five activities included in this resource:
Activity 1 - A fill the blanks activity testing students’ understanding of key cash flow terminology
Activity 2 - A cash flow forecast with missing values that students will need to calculate
Activity 3 - A true or false activity that tests students’ ability to interpret the information from the cash flow forecast they completed for activity 2
Activity 4 - An anagram activity where students have to solve five anagrams of ways businesses can solve cash flow problems. Once solved, they need to briefly explain how each method helps with poor cash flow
Activity 5 - A picture round where students look at 9 good and services, and have to decide which four of the nine are likely to experience short-term cash-flow problems. A brief answer is required underneath explaining their reasons for each answer
All answers have been provided in depth
This can be completed in class / for homework / as a peer marked activity to save you marking!
This worksheet took students around 25 minutes to complete
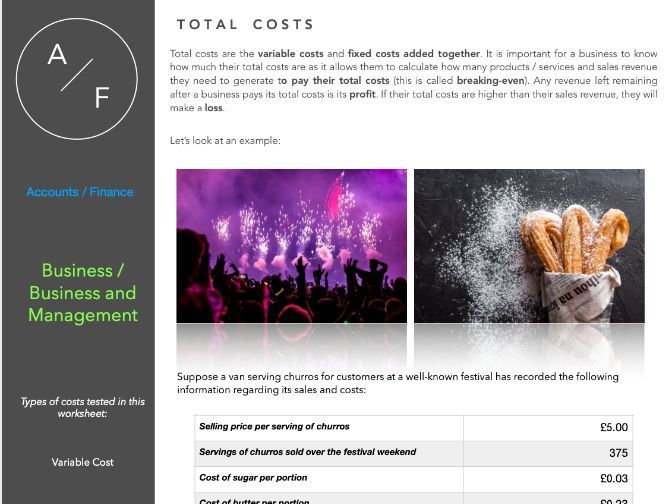
Types of Costs WORKSHEET (Fixed, Variable, Total, Average, Marginal, Direct, Indirect)
This worksheet contains revision notes and activities on how to calculate fixed costs, variable costs, total costs, average costs, marginal costs, direct costs and indirect costs)
All answers are included
The worksheet is colourful and creative throughout
This worksheet contains 7 pages of activities and took my students between 30 - 45 minutes to complete
Can be given as classwork / homework / revision

Market Share
This presentation includes:
A colourful title slide with learning objectives and clickable timer to give students a minute and a half to get down the title
Detailed notes providing explanations of markets, market growth, calculation of market share, how market share increases as well as the benefits of high market share
3 mini activities; 1 - Calculating market share, 2 - Which markets are growing and shrinking in size 3 - Which business is the market leader in 4 different industries
This lesson took me 30 minutes to go through with my students

Business Location
A 20 slide PowerPoint presentation outlining the qualitative and quantitative factors businesses consider when choosing a business location.
The PowerPoint is colouful, informative and includes a ‘Tenable’ game show PowerPoint where students have to identify 10 common reasons why businesses fail

Porter and Lawler (Expectancy theory)
PowerPoint resource on Porter and Lawler includes:
Colourful and interactive title page with animations and timer
Critical Path Analysis network diagram starter activity (with answers)
Detailed notes on Porter and Lawler
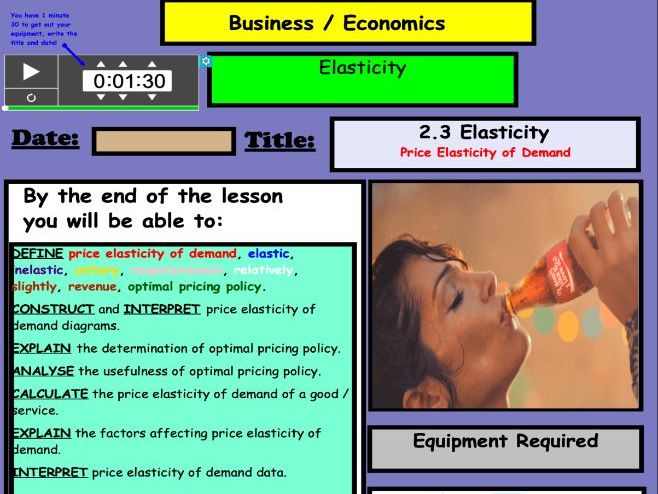
Price Elasticity of Demand
Colourful. Engaging. Informative. This PowerPoint has been creating to introduce students to the concept of price elasticity of demand.
Included in this PowerPoint:
A detailed and colourful title page, highlighting the skills that will be covered over the duration of this topic
A starter activity where students need to rank in order which goods / services would be most to least affected by a change in price
Discussion points
Slides detailing how price elasticity of demand is calculated, with an example
Slides explaining what the numerical values mean (how to interpret them)
Calculation questions with answers
Explanation of the factors affecting price elasticity of demand
This resource took me one hour to go through as a class

Price Elasticity of Demand WORKSHEET
A detailed and colourful worksheet designed to test a range of skills covered in this topic. The worksheet contains 6 activities, each taking between 5 and 15 minutes to complete. It took most of my students between 45 minutes and an hour to finish this worksheet. The activities are as follows:
Activity 1 - A fill the blanks activity that test students’ knowledge of the vocal and terminology used
Activity 2 - Calculating PED, percentage changes and recognising the different types of PED
Activity 3 - ‘Developing your answers’ - students need to recognise and explain factors that influence PED
Activity 4 - Revenue boxes
Activity 5 - Diagrams
Activity 6 - More complex calculations / application
ALL ANSWERS ARE PROVIDED IN DETAIL and have been written in a way that is broken down for students to easily understand. I ran this activity as a peer marking exercise and collected everyone’s work at the end of the lesson to check if there were any gaps in understand to review the following lesson. This saved a lot of time!

Advertising, Media and Peer Pressure
A financial education lesson on advertising, media and peer pressure.
Included:
Colourful and interactive slides with timers, animations and videos
Activities (with answers) throughout
Worksheet included
Detailed notes
There are 37 slides in total and this lesson took me an hour and a half to go through

Critical Path Analysis
Included in this resource is a detailed, colourful, engaging and informative presentation on critical path analysis. I have broken this topic down in easy to understand sections as students often find it very challenging.
The PowerPoint contains:
A detailed and colourful title slide that includes all learning objectives
A fill the blanks recap starter activity on ratio analysis / financial statement. All answers are included.
An explanation of what project management is and its importance. Contextualised examples of projects applicable to critical path are included
**A hyperlink to a great video **of Apple’s new HQ is included. It shows the scale of the project, cost and time taken
An activity where students learn the importance of completing activities simultaneously to save time rather than a sequence
A step by step breakdown over 10 slides on what a network diagram is, what the values and characters mean, and how to work out EST, LFT, critical path.
5 network diagrams ranging in difficulty all with answers provided
Detailed notes and activities on float times
Notes on the advantages and disadvantages of critical path as well as how to evaluate the usefulness of critical path analysis as a planning tool
A separate supplementary worksheet is included in this resource with all of the activities included in the PowerPoint. These can be printed for students. All answer are in the presentation.
Animations have been used throughout to make this as engaging for students as possible
The presentation contains 52 slides and took me two and a half hours to go through with students.

Eduqas A Level Business Exam Tech (Part 1)
This 55 slide resource covers key exam technique skills for Eduqas A Level Business.
Presentation is comprehensive with detailed explanations, examples, questions, mark schemes and links.

Globalisation / Introduction to International Marketing
Using MCDONALD’S TSUKIMI BURGER, Tesco’s failure to succeed in the US, Apple’s failure to succeed in India, and many others, this PowerPoint seeks to explore the reasons why businesses wish to sell in international markets, the challenges and constraints.
Included in this PowerPoint:
A detailed title page, outlining the key skills covered in this topic
A recap on moving averages with answers. This topic is included in some syllabi earlier in the marketing unit but can be deleted if not required
A starter activity introducing the concept of globalisation where students need to match McDonalds products based on the country whey are sold
(demonstrating how products need to be adapted based on the market they are targeting). Answers are provided
An explanation of reasons why businesses choose to sell products in overseas markets
A contextualised example for each reason
Detailed explanations as to each of the reasons why how marketing activities need to change depending on which country goods are being sold
Video 1: Reasons why Tesco failed in US (poor marketing)
Video 2: Reasons why Apple failed in India (poor marketing)
Introduction to some of the factors that make trade between countries easier
This lesson took me an hour and a half to go through.